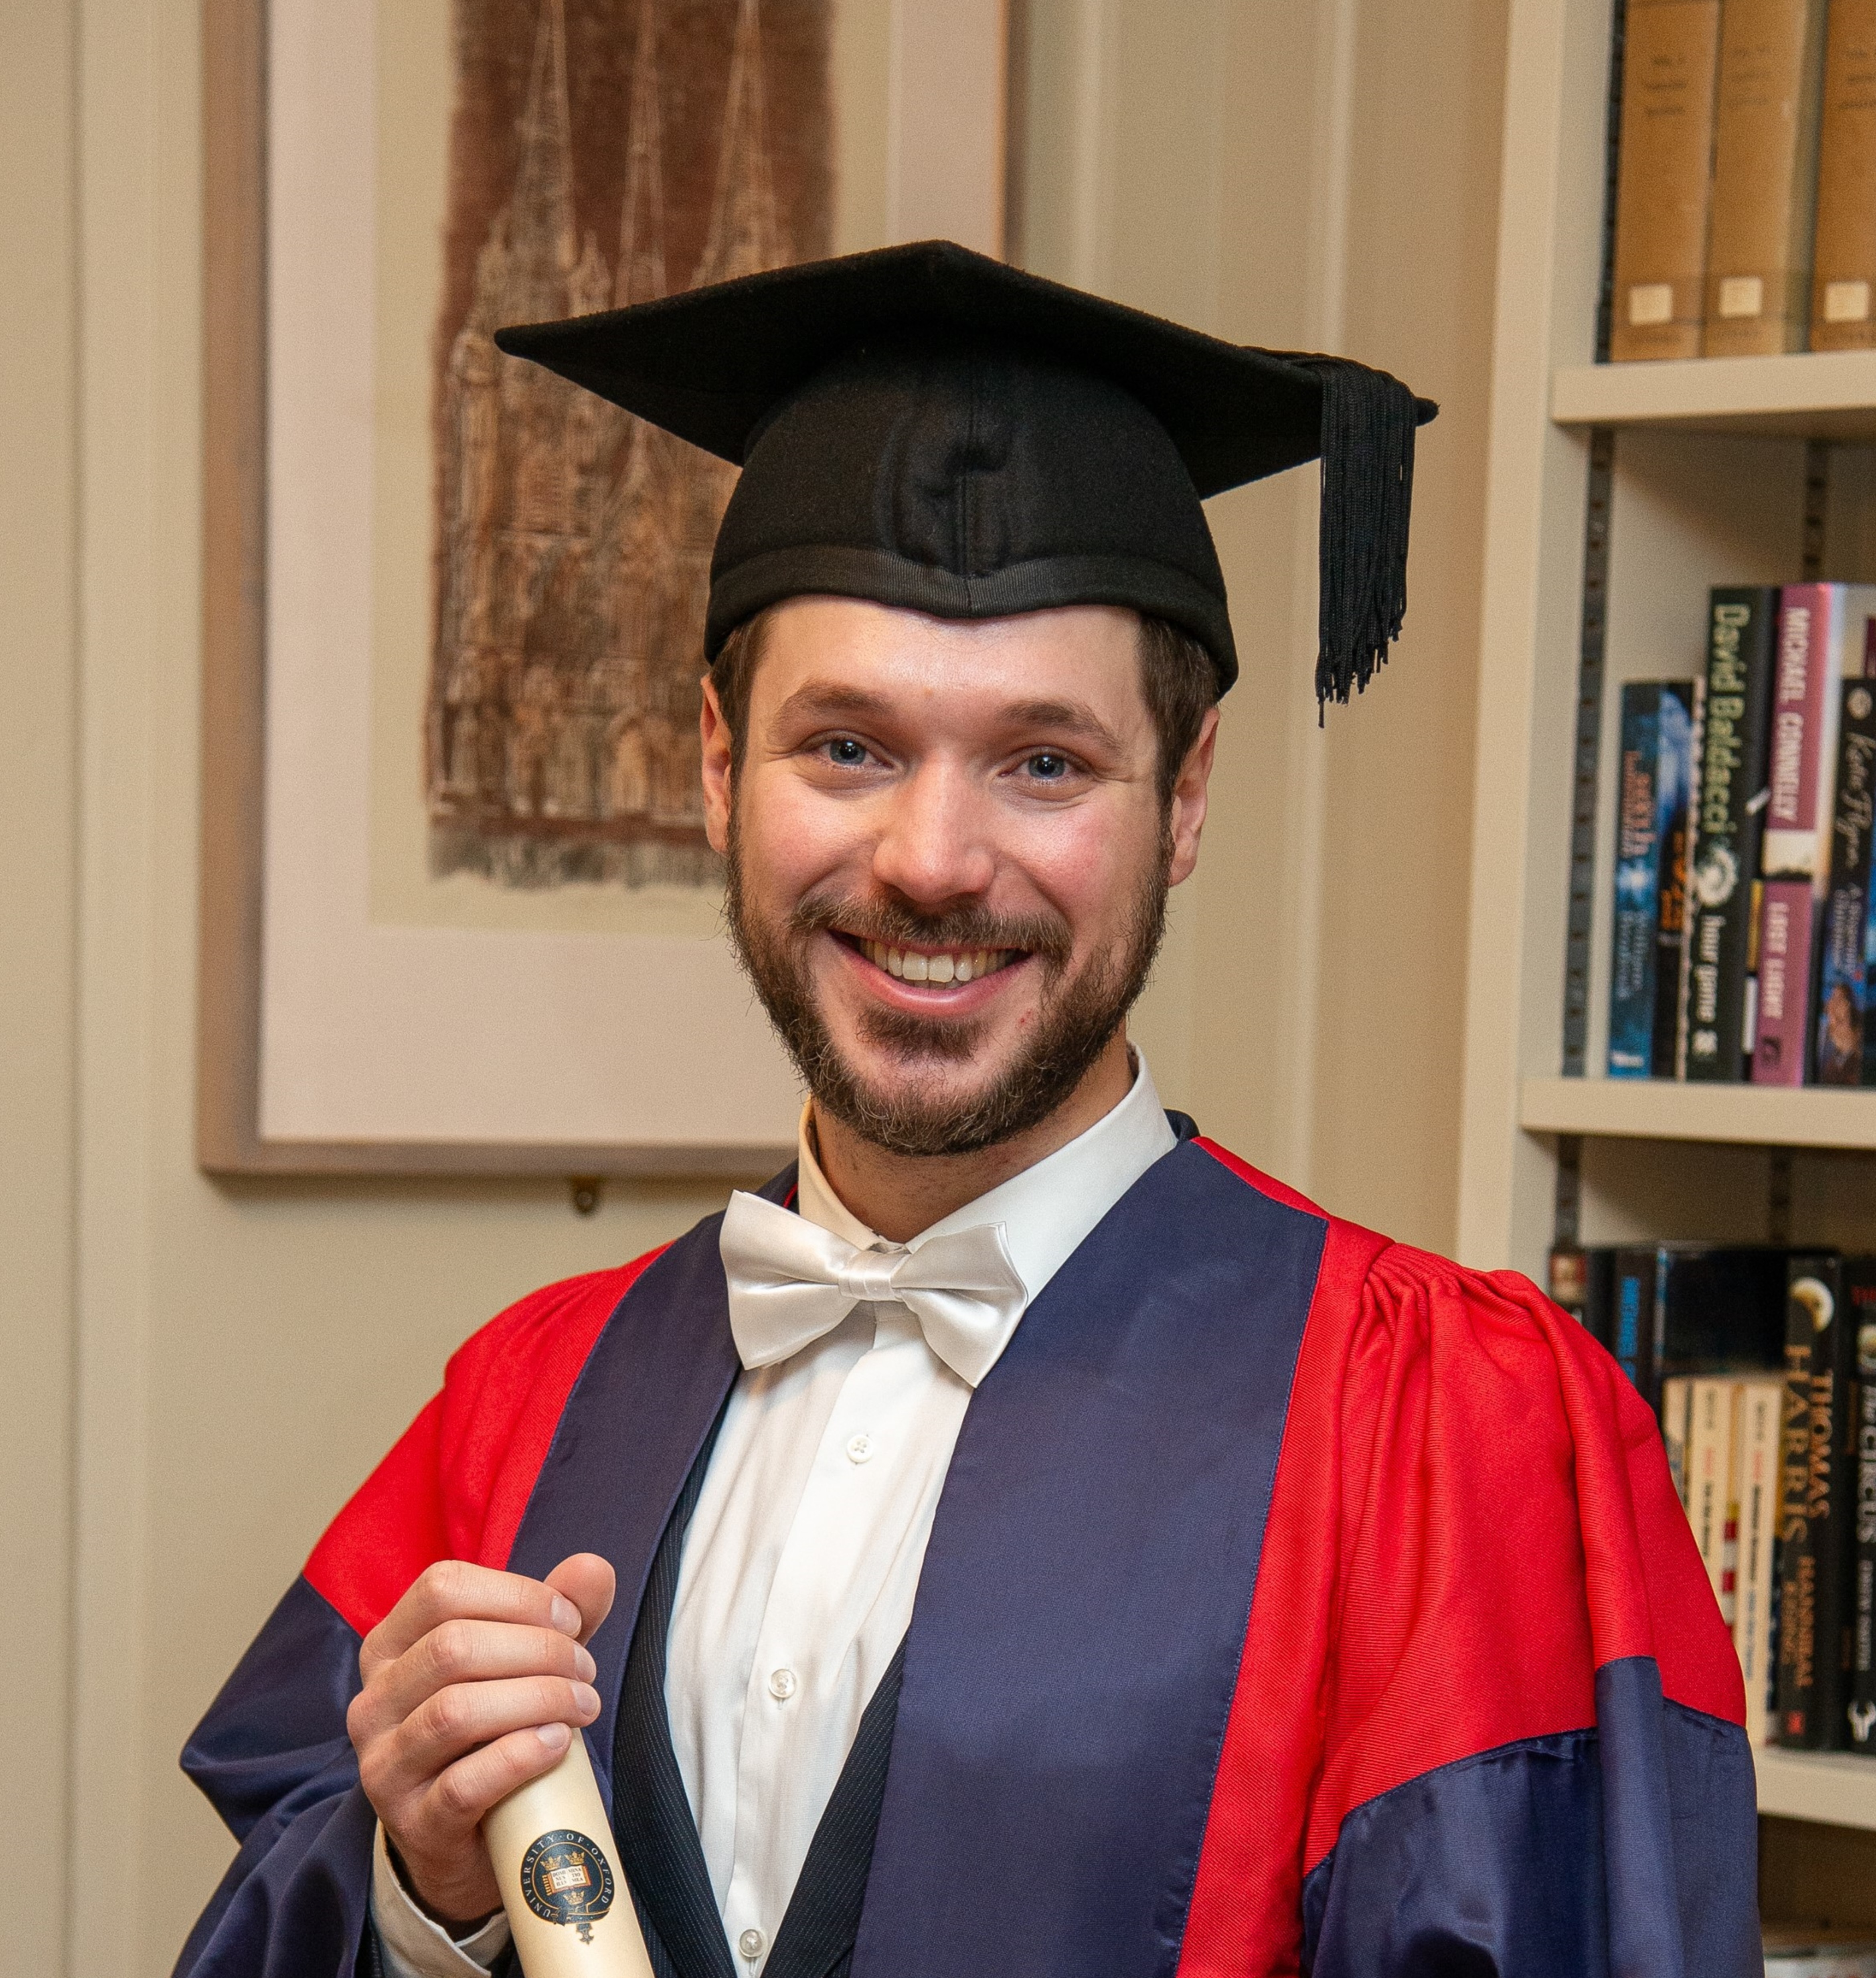
Hi. I'm Tobias Géron.
And I'm an astrophysicist at the University of Toronto.
And I'm an astrophysicist at the University of Toronto.
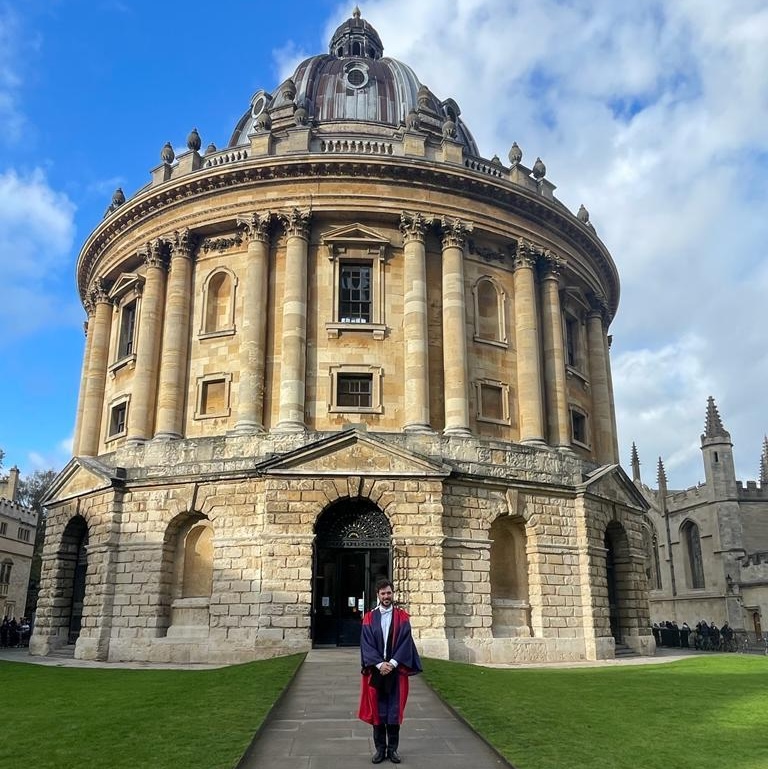
I'm originally from Antwerp, Belgium. I obtained a BSc in Bio-Engineering from the University of Antwerp (2013-2016). After that, I got an MSc in Bio-Engineering from Ghent University (2016-2018), during which I spent one semester as an exchange student at Yonsei University in South Korea. After graduating, I decided to switch academic fields and I started studying Astrophysics at the University of St Andrews in Scotland (2018-2019). I loved this so much, that I eventually pursued a PhD (or, as it is called there, a DPhil) at the University of Oxford, England (2019-2023). Afterwards, I started working as a Rubin Postdoctoral Fellow at the University of Toronto in Canada.
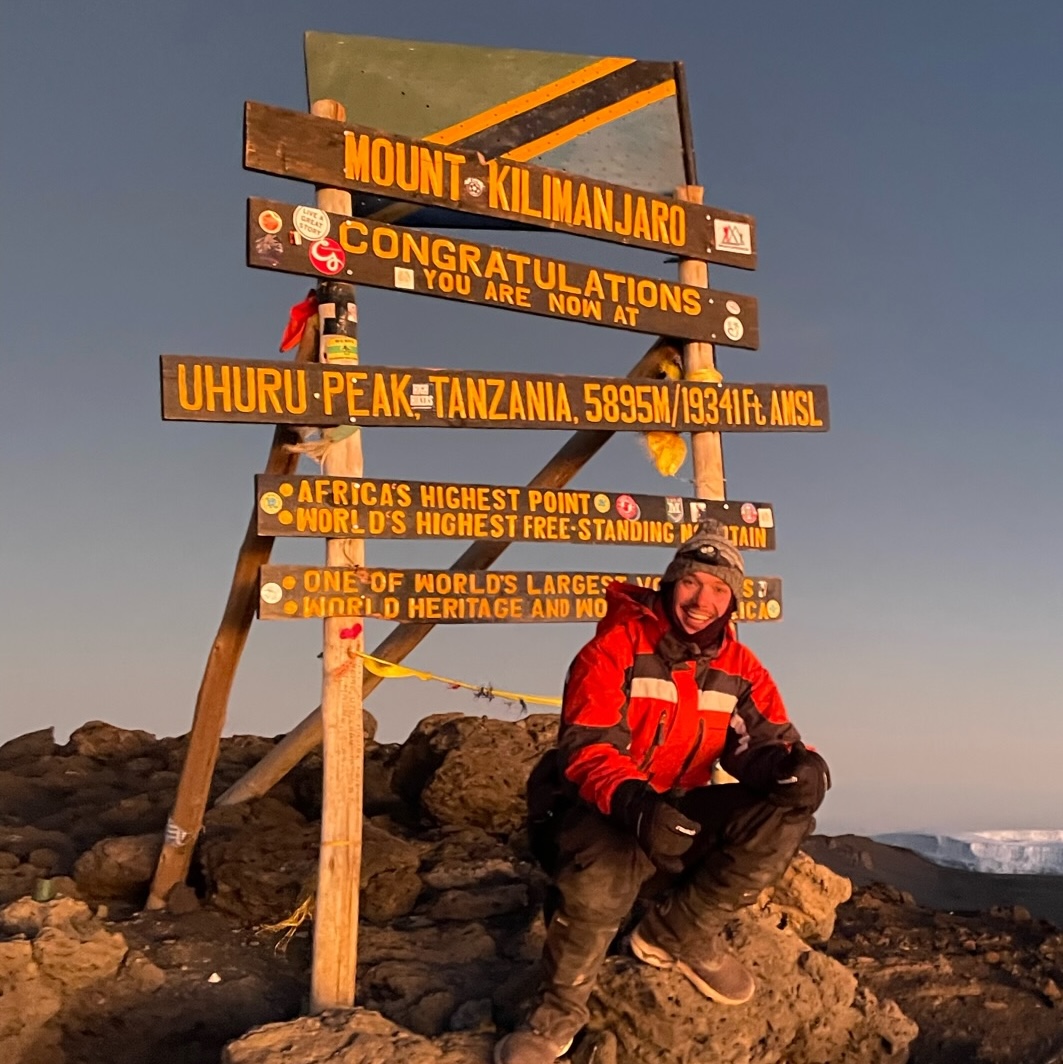
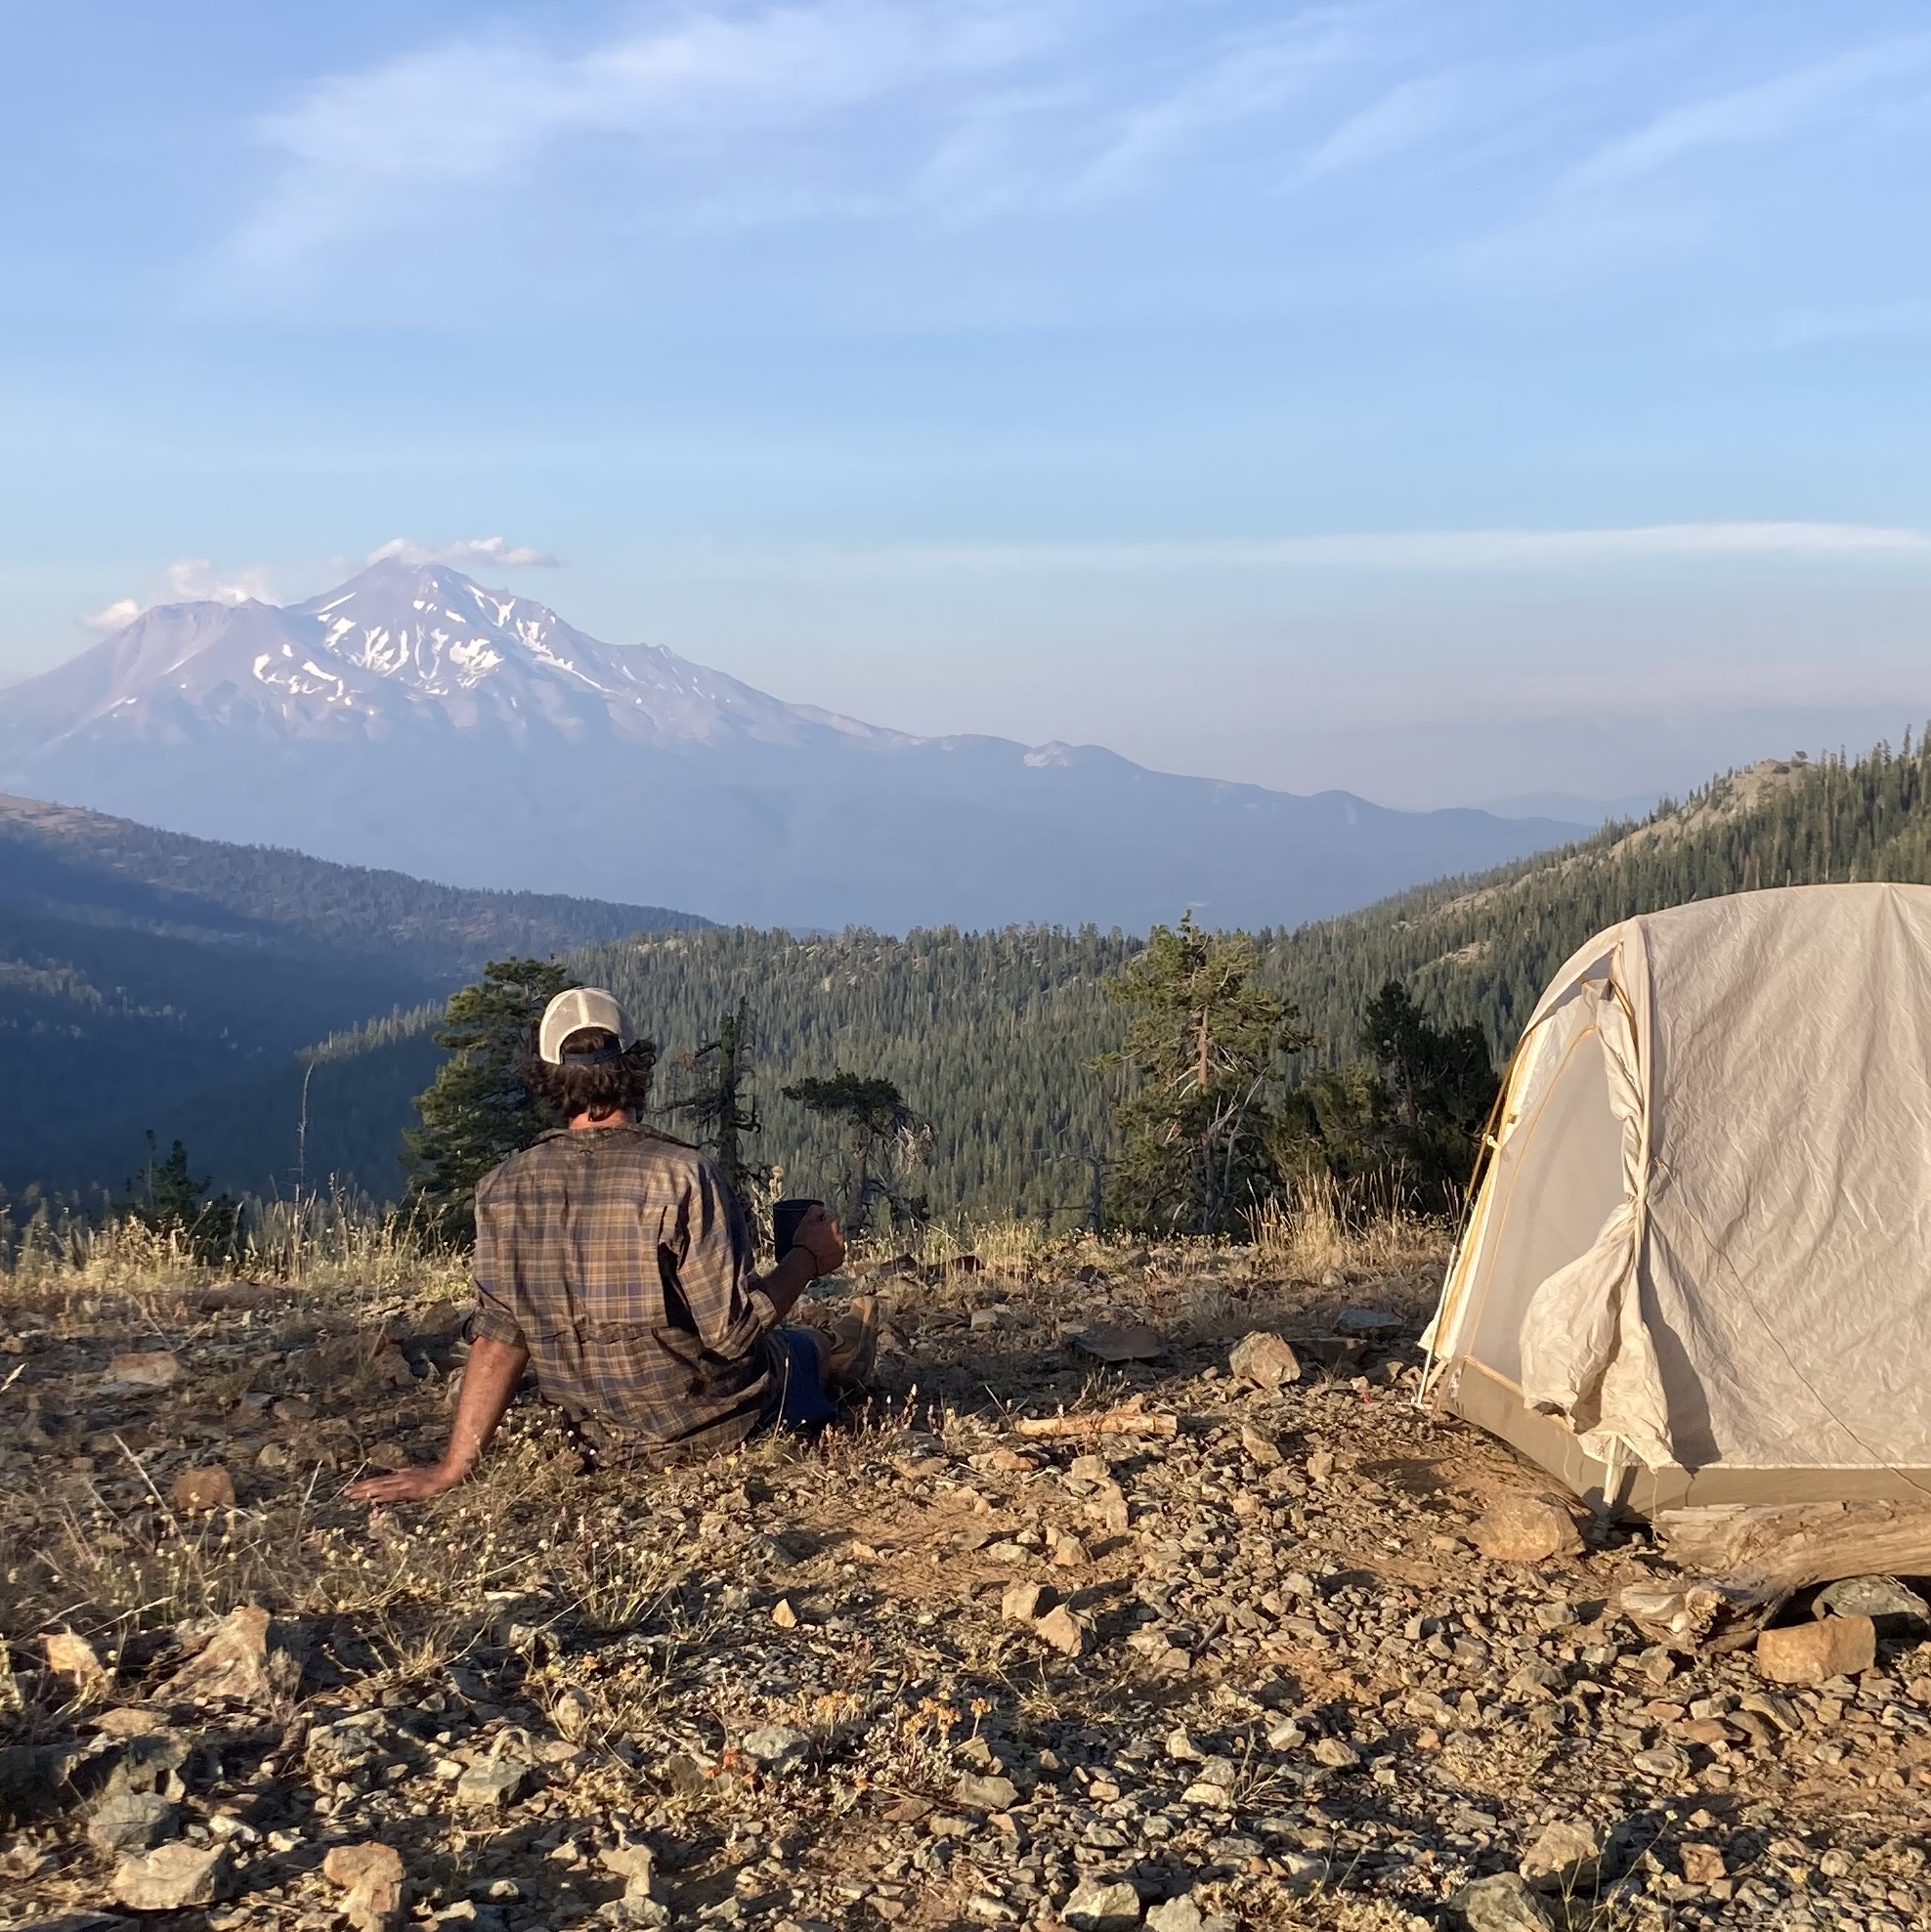
Aside from astronomy, I also really enjoy hiking and being out in nature. Some highlights include climbing Mount Kilimanjaro in Tanzania and through-hiking the Pacific Crest Trail in the USA after I finished my PhD. As you might expect, both trips also included spectacular views of the night sky.
My research spans two branches of astronomy: galaxy evolution and time-domain astrophysics. I am also particularly interested in open-source software development, machine learning techniques, and citizen science.
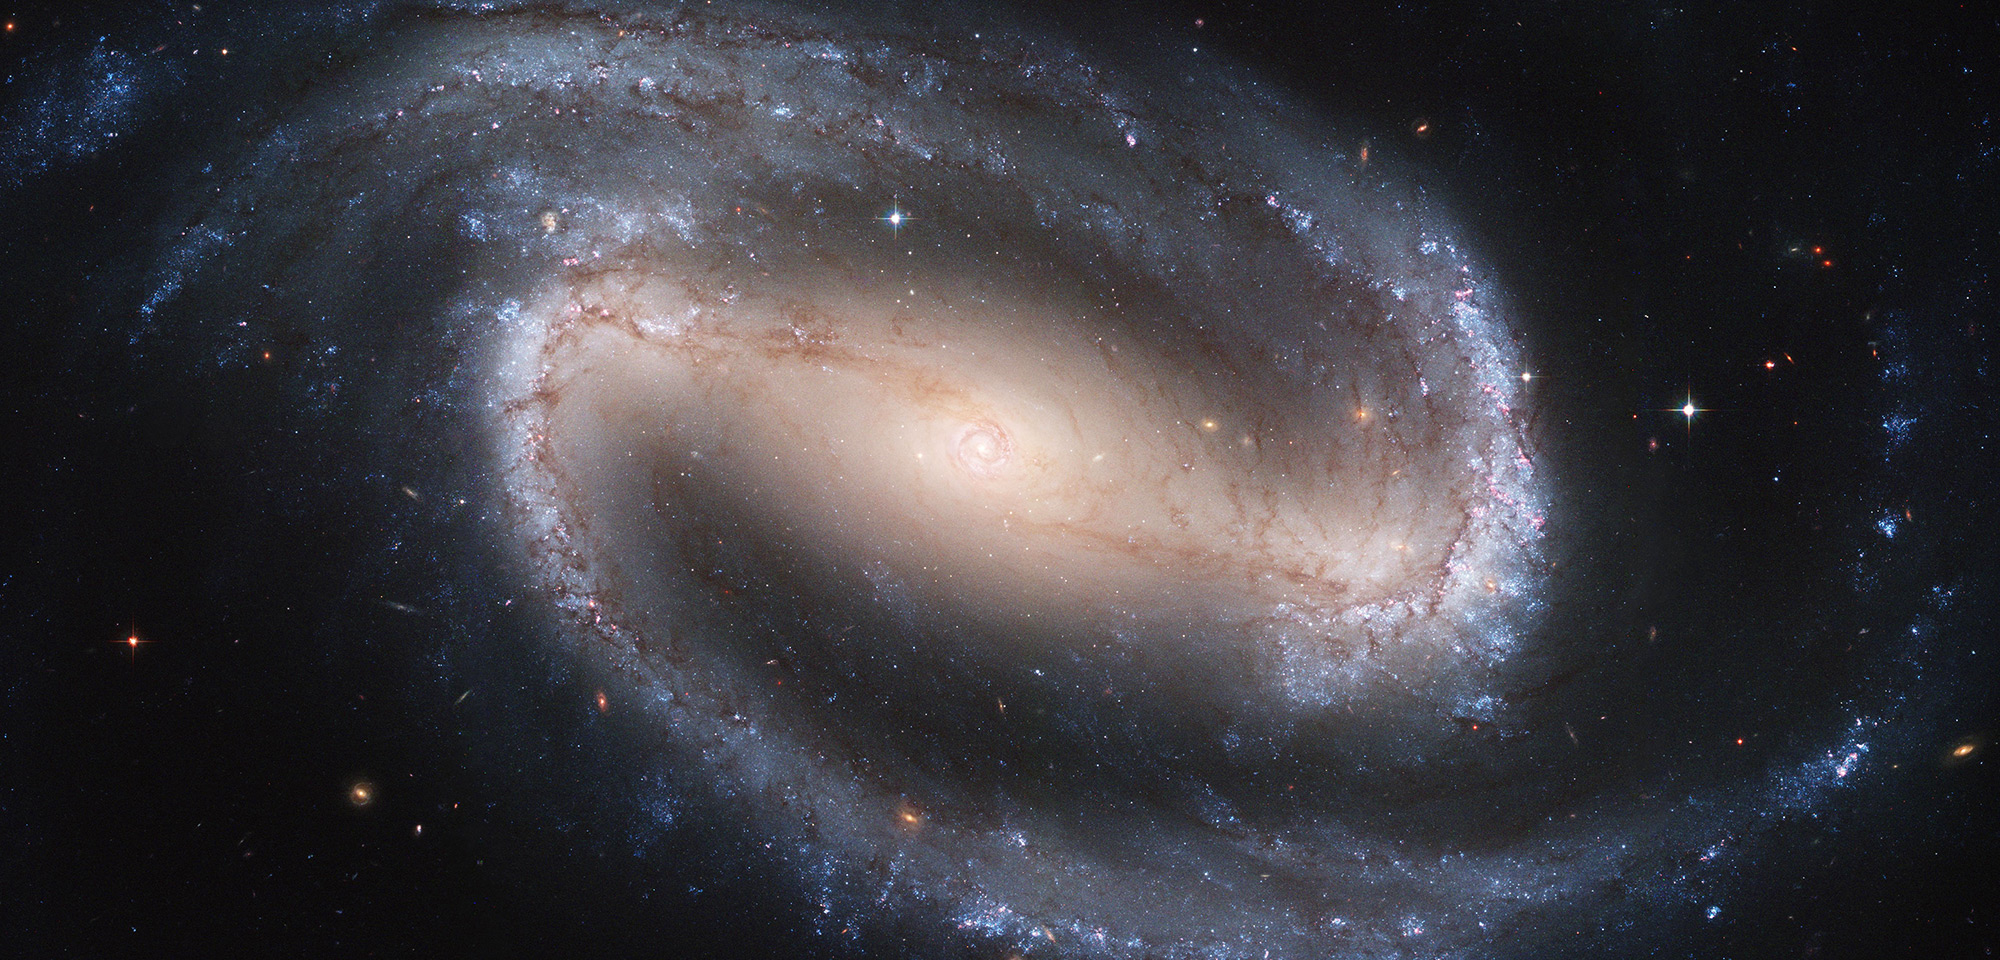
My research during my PhD was mostly focussed on galaxy evolution. More specifically, I looked at how bars, like the one shown to the right, affect star formation and quenching in their host galaxies. The barred galaxy shown here is called "NGC 1300" and is arguably the most famous barred galaxy. More information on this particular galaxy can be found here. Observations have found that bars appear more often in quiescent galaxies. However, it is uncertain whether it is easier to form a bar in a quenched galaxy or if a bar helps to quench its host - basically a chicken or egg problem on galactic scales. Additionally, roughly half of all nearby disc galaxies have a bar, so understanding how they affect their host is important to properly understand the evolution of galaxies as a whole.
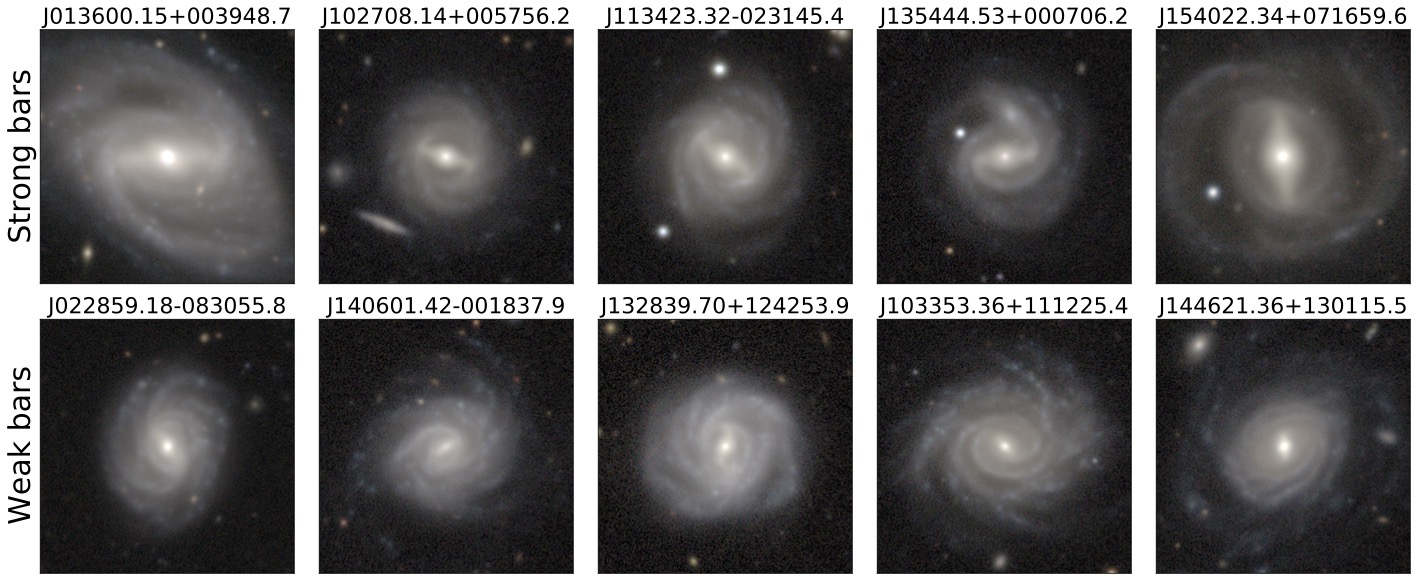
Historically, people have typically focussed on very strong and obvious bars, such as the ones displayed on the top row of the figure below. This is mostly because they are easier to identify and observe. However, as in turns out, bars come in all shapes and sizes. The bars on the bottom row in the figure below are much fainter and weaker, but they are bars nonetheless. In my first paper, I looked at how both weak and strong bars affect their host. One of the key results was that weak and strong bars seem to be part of a continuum of bar types that vary from weak to strong, with strong bars being able to affect their host more. If a bar is stronger, it will induce more star formation in the center of a galaxy, which in turn will help to quench the galaxy quicker. These results are presented in much greater detail in (Géron et al. 2021).
In order to study strong and weak bars, we first need to identify them in galaxies. This was done using Galaxy Zoo, a citizen science project where volunteers can help scientist by classifying the morphology of galaxies. During my PhD, I helped create the Galaxy Zoo DECaLS and Galaxy Zoo DESI catalogs by downloading and uploading images to the project and aggregating the classifications into a final catalog. This involved working with large amounts of data -- Galaxy Zoo DESI contains a total of ~8.7 million galaxies with reliable morphological classifications! Since then, I've been involved in many more iterations of Galaxy Zoo, such as Galaxy Zoo Euclid and Galaxy Zoo CEERS.
I have also spent some time measuring how quickly bars rotate within a galaxy (i.e. their "pattern speed") using a technique known as the Tremaine-Weinberg method. In order to do this, I used data from a survey called MaNGA. The cool thing about MaNGA is that it is an IFU survey, which means that it obtains spectra at multiple positions across the face of a galaxy. This means that we have access to reliable kinematic data (i.e. how the stars move) at multiple points for one galaxy. Using this technique, I was able to create the largest catalog of pattern speeds for strongly and weakly bared galaxies to date. One of the interesting results that came out of this study is that the strong bars rotate significantly slower than weak bars. These results, and more, are presented in Géron et al. (2023).
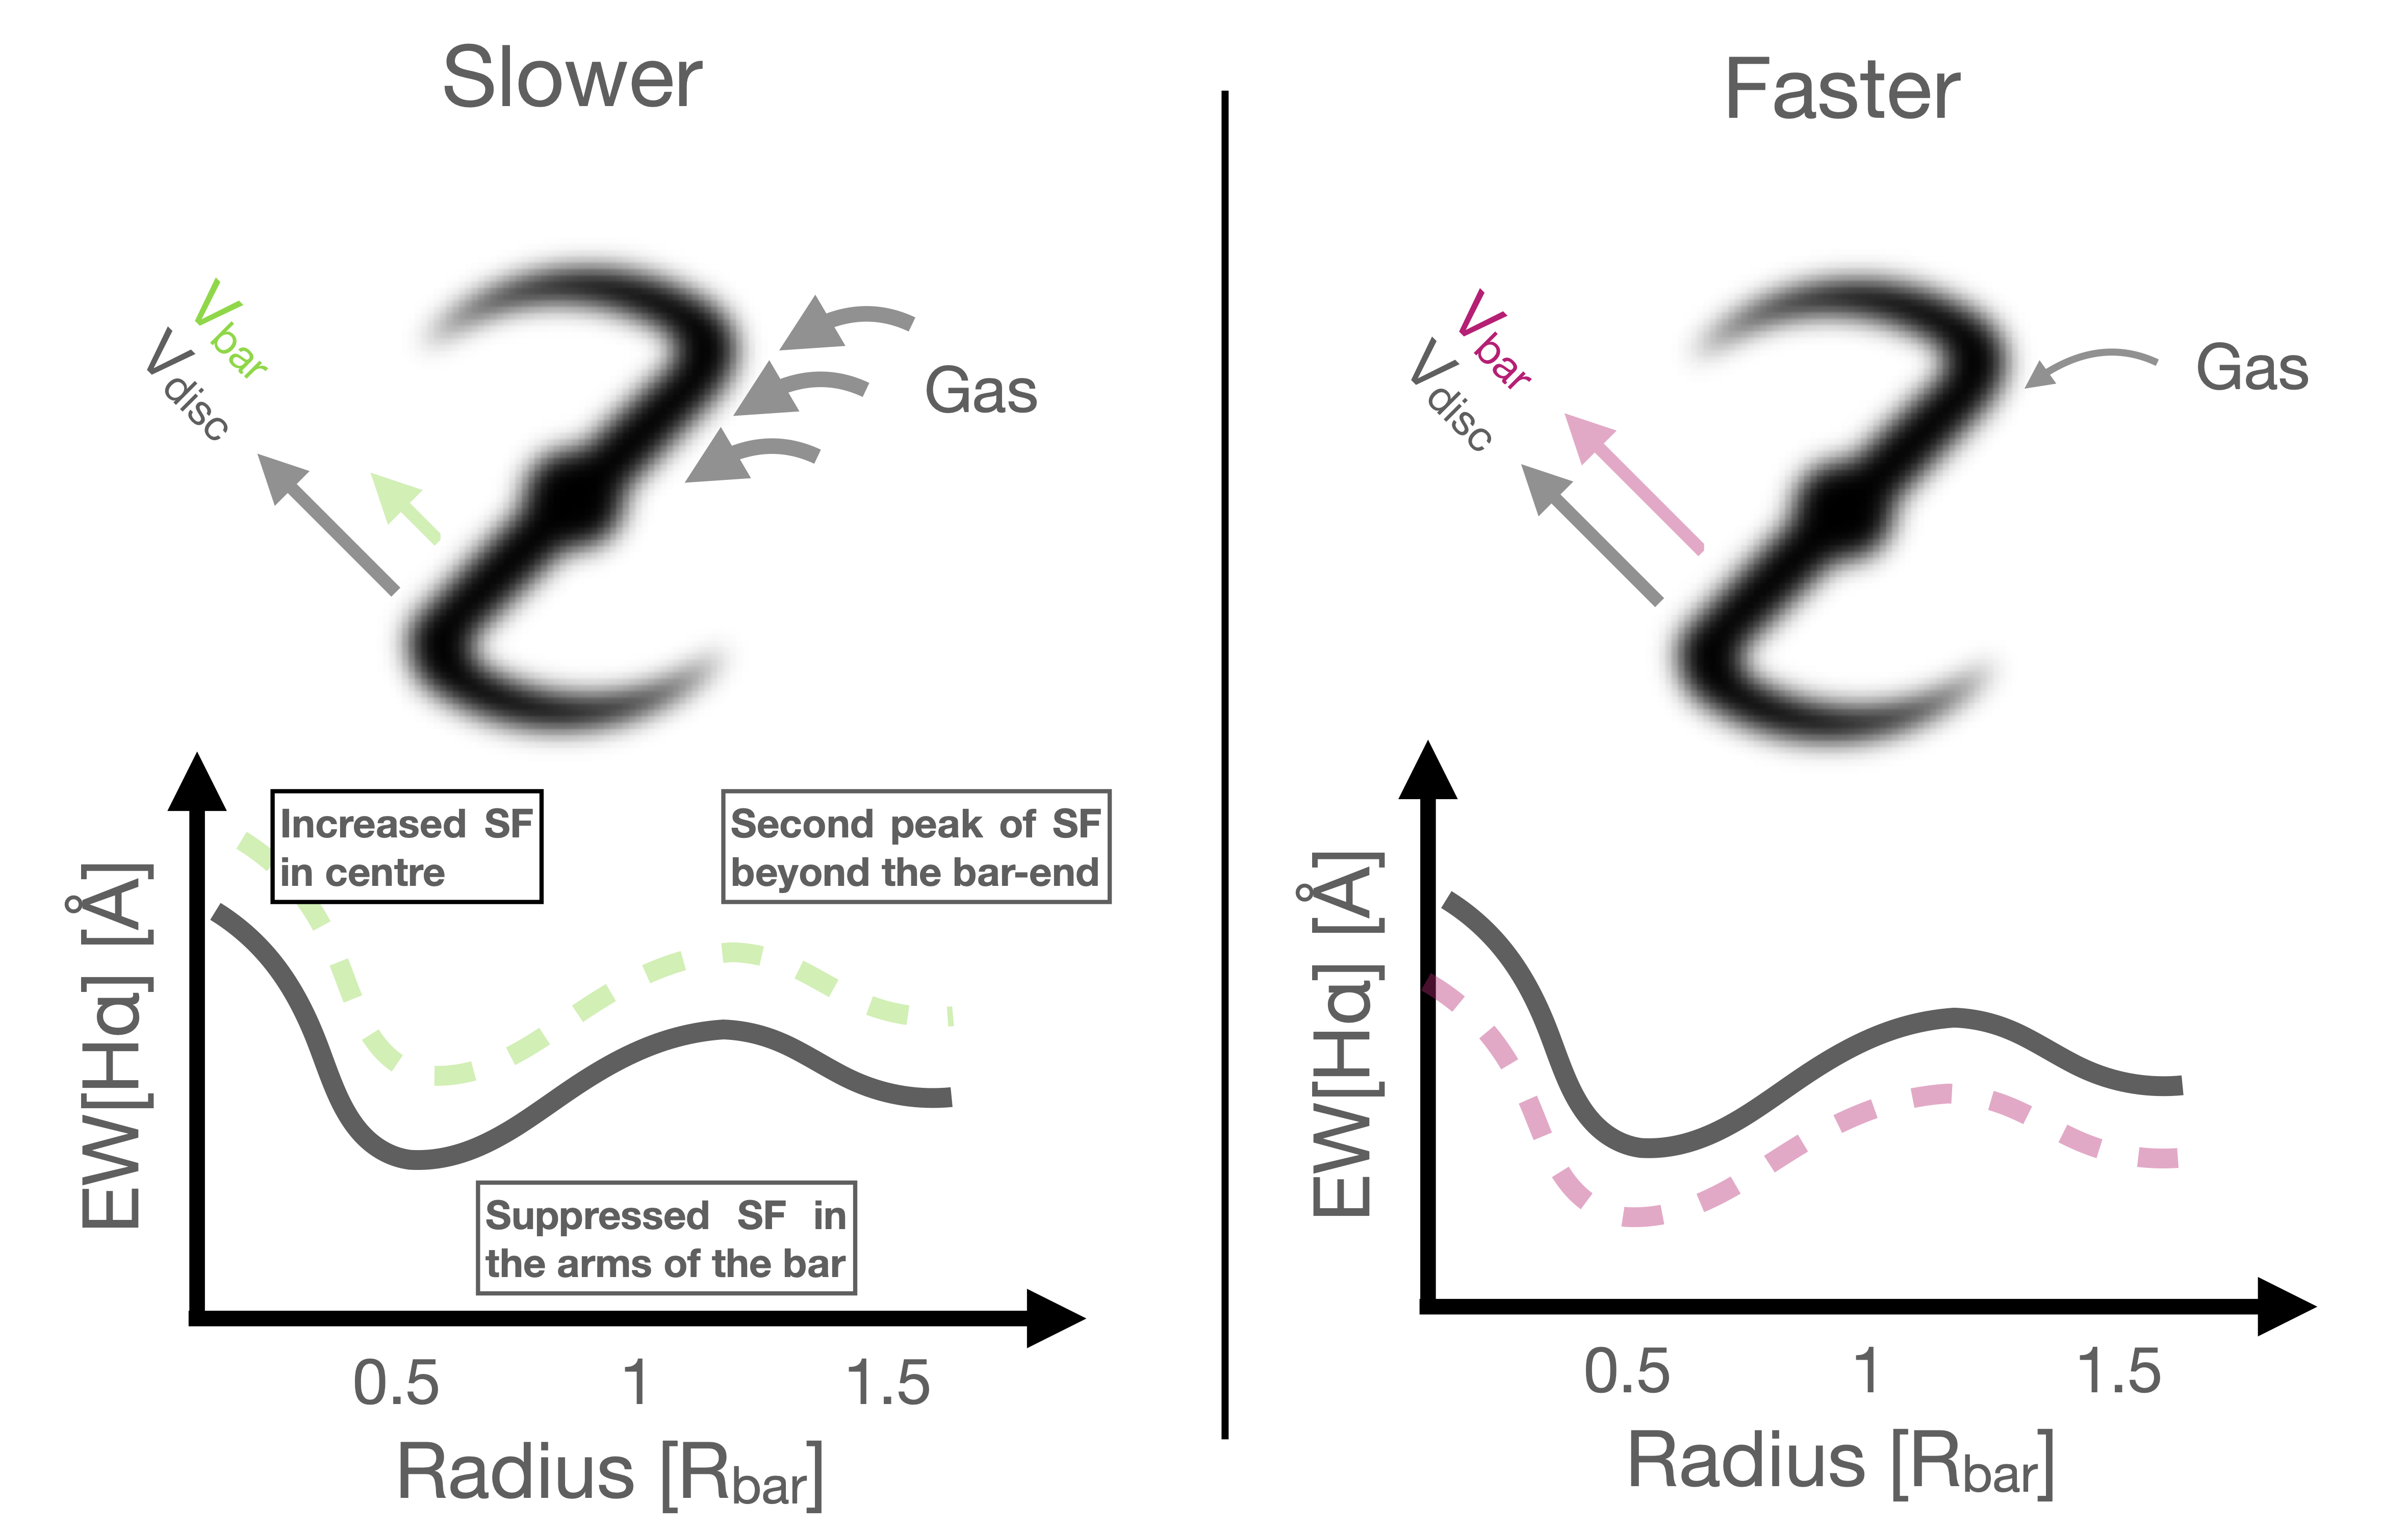
More recently, we found that strongly barred galaxies have a peak of star formation specifically in the centre of the bar, as well as around the bar-end region. The star formation is suppressed in the arms of the bar. Interestingly, when we loop bar kinematics back into the picture, we also noticed that bars that are both slow and strong show the highest amount of star formation along the axis of the bar. This suggests that the kinematics of the bar influences the star formation rate. We now think that this observation can be explained by carefully thinking about how the bar and the surrounding disc rotate. In short, the difference in velocity between the bar and the disk is larger for slow bars than for fast bars. Because of this, a rotating slow bar will come into contact with much more of the gas of its host, compared to a fast bar. This suggests that slow bars are able to possibly trap and concentrate more gas along the bar than fast bars. This increased concentration of gas will increase the amount of observed star formation along the bar axis for slow bars. This is visualized in the figure on the right. This suggests that the kinematics of the bar, as well as the morphology of the bar, plays an important role in dictates galaxy evolution. If you're interested to learn more about the kinematics of bars, check out this interactive tool. Please note that this tool is still under development. I wrote a more detailed blog post about this work, which you can find here, if you are interested. You can also always look at the paper itself: Géron et al. (2024).
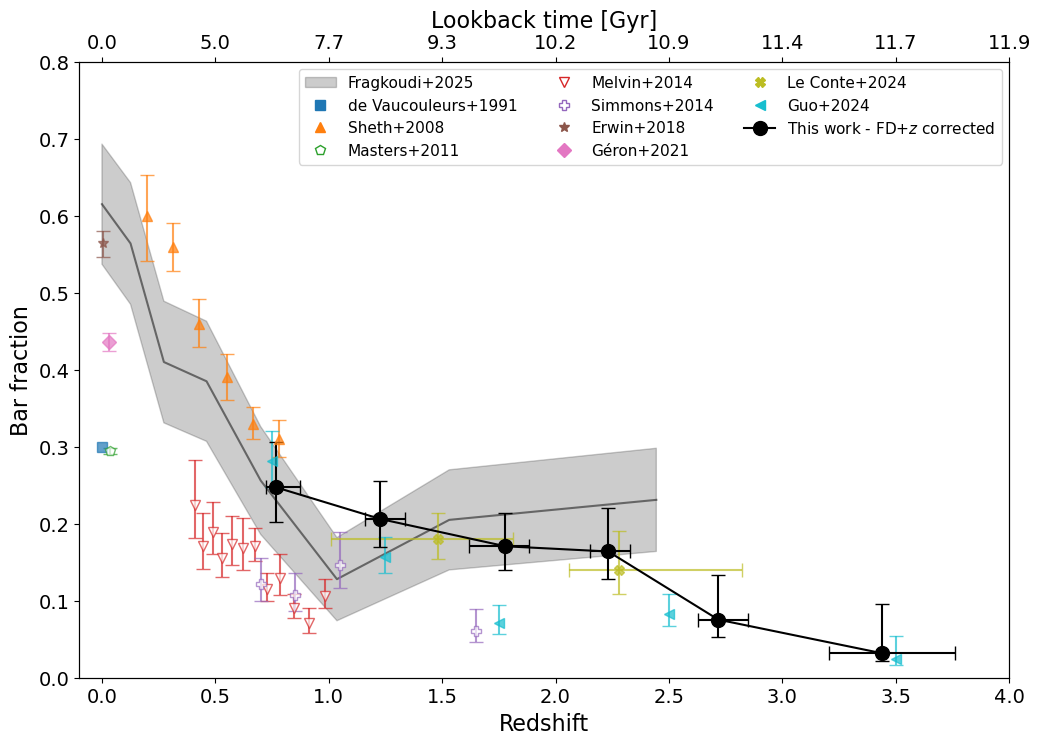
With the extraordinary JWST, a telescope in space, we can now take pictures of galaxies that are really far away. Due to the finite nature of the speed of light, looking at faraway galaxies means that we are also looking back in time. Astronomers quantify this with a property called "redshift". A redshift of 0 corresponds to the present-day Universe, while higher redshifts means looking back further in time. This sounds a bit abstract, but a redshift of ~2 corresponds to a looking back 10 billion years in time. To put this in perspective, the Universe is only ~13.7 billion years old. We can leverage this to our advantage to study how the morphology of galaxies changes over time. This was done with a recent iteration of Galaxy Zoo called GZ CEERS, where volunteers classified images from the CEERS survey. As I am particularly interested in barred galaxies (see all the paragraphs above for why barred galaxies are fun), I wanted to study how many galaxies have bars, as a function of time. The results are shown in the figure on the right. The different coloured dots are results from other papers, while the black full line is our result. In the present-day Universe, roughly half of all galaxies have a bar. However, going back in time, we find that fewer galaxies have bars. This is expected, as it takes time for a bar to form. However, the main takeaway is that we still find a lot of bars in the early universe. Even at a redshift of 2, which corresponds to ~10 billion years ago, already 20% of all disk galaxies had a bar! This has all kinds of implications for the formation mechanisms of bars, structure of galaxies in the early universe, and galaxy evolution in general. If you are interested, I wrote a slightly more detailed blog post about this work here. Alternatively, you can find much more information in the paper: (Géron et al. 2025)
I am also interested in various topics in time-domain astrophysics and am part of the Transient and Variable Star Science Collaboration of the Vera Rubin Observatory. I moved to Toronto as a Rubin Postdoctoral Fellow, and have spent the past few years writing software and preparing for Rubin's LSST. Rubin is expected to collect ~20 terabytes of data and generate an estimated ~10 million transient alerts each night, so being prepared for such a huge amount of data is important.
The progenitors of core-collapse supernovae (SNe) were historically thought to be relatively static in the final moments before explosion. However, recent observations challenge this view. We now know that around ~9% of core-collapse SN show signs of strong interaction with nearby dense circumstellar material (CSM). These are also called `SN Type IIn'. Interestingly, even many `normal' SNe observed within a few days of explosion also suggest the presence of a dense CSM. However, the origin and prevalence of this material remains unclear. One possible hypothesis is that this CSM is the result of eruptive outbursts (i.e. `mini explosions') shortly before the actual SN explosion. This so-called `pre-SN variability' has been observed in ~50% of SN Type IIn, but seems rare in other SN types. Detecting the presence (or absence) of this pre-SN variability is central to understanding the origin of this dense CSM and its formation mechanism. On 11 April 2024, a supernova called SN 2024ggi was detected in a very nearby galaxy. It was classified as a SN Type II, and different groups have confirmed the presence of a dense CSM. This makes it an ideal target to look for pre-SN variability! I am currently analysing its light curve for any hints. Stay tuned, more updates coming soon!
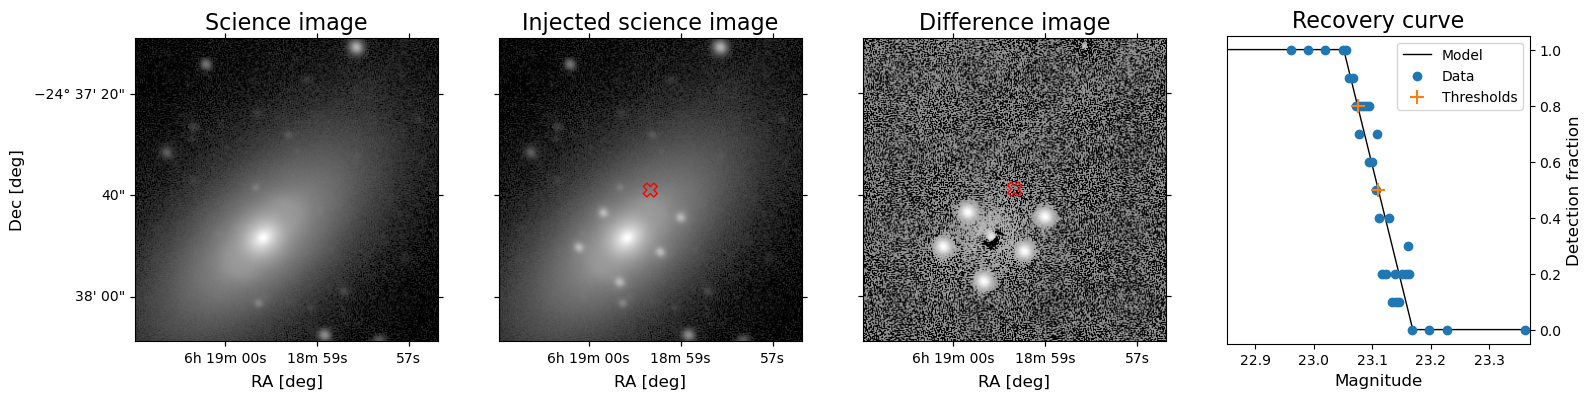
In order to make the search for pre-SN variability easiest with the upcoming Vera Rubin Observatory, I developed Detection Efficiency and Threshold Estimation for Characterization of Transients, or DETECT (yes, I am proud of the acronym). It is a Python package built to correctly characterize detection thresholds for any image taken by the Rubin Observatory. This is important as even state-of-the-art image subtraction pipelines struggle when the target is embedded in a nearby bright galaxies (and interesting pre-SN variability targets usually are). The DETECT pipeline works by performing a series of source injection, image subtraction, and forced photometry, as shown in the image below. The code is publicly available here. More information coming soon!
Email:
tobias.geron@utoronto.ca
Address:
Dunlap Institute for Astronomy & Astrophysics
University of Toronto
50 St. George Street
M5S 3H4, Toronto, Ontario
Canada